How Manual Testers Can Read and Use Stack Traces Effectively

Introduction
As a manual tester, you've probably encountered cryptic error logs or stack traces that developers use to debug issues. While it may seem like stack traces are a realm best left to developers, understanding how to read and interpret them can be a game-changer for your testing efficiency and collaboration.
In this article, we’ll demystify stack traces and explain how manual testers can use them to identify bugs, validate issues, and contribute more effectively to the development process—even without writing a single line of code.
What Stack Traces Are and When They’re Logged
A stack trace is essentially a snapshot of a program's call stack at a specific moment—usually when an error occurs. It shows the path that code execution took through the application’s methods and functions before hitting a problem. Think of it like a breadcrumb trail that helps pinpoint where things went wrong.
Stack traces are usually logged when an unhandled exception occurs—this means the application encountered a runtime error that wasn’t caught or managed in the code by the developer. In other words, the code didn’t include any error-handling logic (like a try-catch block) to deal with the situation, so the program terminated the operation and logged the error. Common examples include NullPointerException or IndexOutOfBoundsException. Stack traces may also appear when a caught exception is explicitly logged by developers, or during system events like startup failures or misconfigurations. These traces typically show up in application logs, frontend browser consoles, or CI/CD pipeline outputs depending on the system.
How to Read Stack Traces and Navigate the Code
Reading a stack trace might look intimidating, but it's often more straightforward than it seems—especially when you know what to look for. Here’s an example:
Exception in thread "main" java.lang.NullPointerException
  at com.minorbug.orders.OrderService.sendEmail(OrderService.java:16)
  at com.minorbug.orders.OrderService.printCustomerInfo(OrderService.java:7)
  at com.minorbug.orders.OrderService.main(OrderService.java:20)
  at java.base/java.util.concurrent.ThreadPoolExecutor.runWorker(ThreadPoolExecutor.java:1136)
  at java.base/java.util.concurrent.ThreadPoolExecutor$Worker.run(ThreadPoolExecutor.java:635)
  at java.base/java.lang.Thread.run(Thread.java:833)
This stack trace indicates a NullPointerException occurred in your application. A NullPointerException happens when the program tries to use an object reference that hasn’t been assigned a value—meaning it’s null. The key lines to pay attention to are the ones that refer to your own project’s code. You can usually recognize these by the package or namespace prefix—in this example, lines starting with com.minorbug indicate files that belong to your application. This indicates these lines are most relevant for debugging:
OrderService.java:16OrderService.java:7OrderService.java:20
Lines referring to standard Java libraries (like ThreadPoolExecutor or Thread.run) are typically not the source of your issue and can be ignored in most cases. Focus on the parts of the trace where your own code is involved—especially the topmost one, which is often where the error was actually thrown.
To better understand the situation, testers can open OrderService.java in their IDE and use a tool like Git blame. This feature allows you to view, line-by-line, who last modified each part of the file, when the change was made, and often includes the commit message—such as a reference to a JIRA task ID.
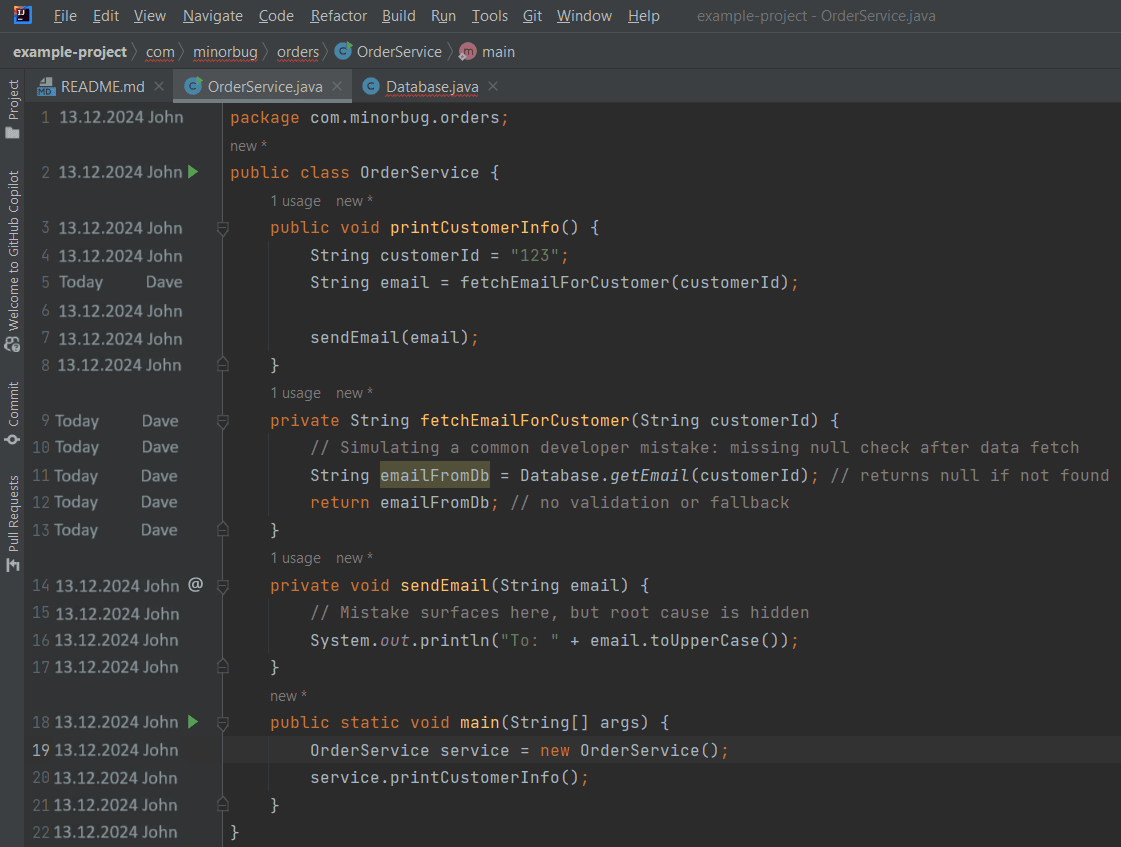
The stack trace shows that the application crashed with a NullPointerException. According to the first line, the error occurred in OrderService.java at line 16, inside the sendEmail method. Tracing back the call chain, we see that sendEmail was called by printCustomerInfo at line 7. But if we look slightly earlier, at line 5, we find that the email address being passed was fetched by calling fetchEmailForCustomer.
The method fetchEmailForCustomer is responsible for retrieving the email address from the database. In this example, that method relies on Database.getEmail(), which returns null in this example. From a code perspective, the issue is that there’s no validation or fallback logic in place to handle the possibility that the returned email might be null. That unchecked value is then passed to sendEmail, where the code attempts to call toUpperCase() on it, triggering the crash.
Seeing a related ticket number (e.g., BUG-456 or FEATURE-123) in the commit history can help you trace which task the change was associated with, understand the purpose behind it, and get a hint about what kind of test data to focus on—for example, which user or email values might be relevant in this scenario. Knowing which test data triggered the problem also gives you a clear idea of how to avoid the bug temporarily so you can continue testing other functionality. This not only helps you move forward efficiently but also makes you a more independent tester and reduces potential slowdowns in the testing process.
Why the Problem Isn’t Always a Code Bug
Not all errors are caused by faulty code. Sometimes, stack traces reveal issues rooted in the test environment or data setup. One common example is when testers manually create test data—such as inserting records directly into the database to speed up testing or bypass UI flows. This means the validation checks that are normally enforced by the application are skipped. If a NullPointerException occurs because a required value (like an email or user role) was never set, it's not a code bug—it’s a test data issue. In such cases, reporting it as a bug wastes time for both the developer and the tester. Identifying and fixing the invalid test data yourself is often the faster, more effective approach.
Similarly, some stack traces may point to problems caused by incorrect or incomplete environment configurations—for example, missing environment variables or service URLs. If the tester has access to the environment settings, these issues can often be resolved without involving the developer at all. By recognizing when the root cause lies outside of the code and correcting it directly, testers can avoid unnecessary bug reports, save time, and keep the testing process running smoothly.
By investigating the lines of source code mentioned in the stack trace, testers can often gather important clues about whether the root cause truly lies in the code—or if it's related to missing data, misconfiguration, or other external factors. This kind of proactive debugging helps testers become more independent, avoid unnecessary escalations, and ultimately improve the efficiency of the entire testing process.
When the Real Issue Happened Earlier
Stack traces only show where the failure was detected—not necessarily where the actual problem began. Because of this, testers should apply critical thinking when investigating stack traces instead of assuming the top line tells the whole story. For example, a user account might have been created with corrupted or incomplete data due to an earlier issue. The system doesn’t crash immediately, but later—perhaps during login, reporting, or billing—it encounters that bad data and throws an exception.
In such cases, the stack trace points to the method where the failure surfaced, but the underlying cause might lie several steps earlier. While the topmost line in the stack trace that refers to your application code is often the most important, it’s just one piece of the puzzle. Don’t overlook the earlier lines in the trace that called the failing method. Those upstream calls may reveal that a method was invoked with incorrect input, such as a null value or a wrong parameter passed from another part of the system.
Understanding the full flow—from how the logic was triggered to where it finally failed—helps testers spot patterns, identify root causes more accurately, and avoid misreporting symptoms as standalone bugs.
Final Thoughts
Reading stack traces may seem like developer territory, but manual testers who learn to interpret them can dramatically improve their bug reports, reduce developer guesswork, and become stronger contributors to the QA process. You don’t need to debug every problem or fully understand every line of code. But by spotting patterns, recognizing where errors occur, and knowing when to ask the right questions, you bring clarity to issues faster and more efficiently.
That said, it’s just as important to know when to escalate. If you don’t have access to the codebase, if the stack trace points to a dependency or external system outside your scope, or if the code is simply too complex to confidently understand, don’t get stuck trying to figure it out alone. Instead, gather the stack trace, note the user actions and test data involved, and forward everything to a developer. That context alone can save them valuable time and lead to faster resolutions.
Stack traces are a powerful tool—not a puzzle you’re expected to solve entirely on your own. By working through these steps, testers improve collaboration and contribute to faster, more effective debugging workflows.
Want to become even more confident when navigating technical issues? Read Why Manual Testers Should Read Source Code to learn how understanding basic code behavior can transform your approach to testing.